The Ins and Outs (and Ups and Downs) of Ocean Data
The condition of the background ocean has a huge influence on the health and welfare of farmed fish. Properties like temperature, oxygen, and salinity are constantly changing with variations in ocean currents, tides, wind, precipitation, air temperature, and biological activity. If these changes are drastic enough, they can result in mass mortality events at a farm site. At Scoot Science, we’re focused on helping farms better understand how the background ocean is changing, and how that might impact production at their sites.
Forecasts of ocean conditions a few days into the future offer farmers an opportunity to prepare for and mitigate the impact of extreme events. But ocean forecasts are a little more complex than the land-based forecasts we’re all used to. While land-based temperatures are usually provided for a specific point on the ground, in the ocean we’re interested in the temperatures throughout a vertical water column. That data is much easier to interpret as a visualization, rather than as a long table or list of temperatures at each depth.
Plotting Ocean Data
Depth profiles are typically used to show how a single parameter is changing with depth, while time series plots show how a parameter at a single depth is changing over time. To display how a parameter is changing with depth and over time, depth profiles and time series plots are combined into what we call contour plots.
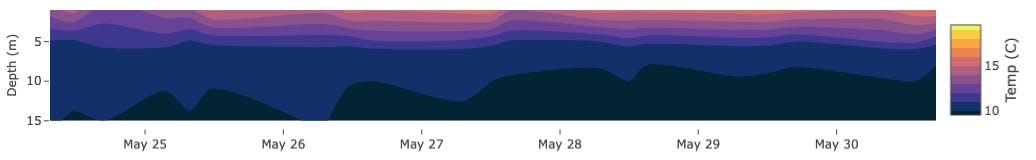
The contour plot below is showing one farm site’s water temperatures between May 25 - 30th. The darker areas at the bottom indicate colder water at depth (less than 10°C), with warmer water (lighter colors) towards the surface. Over the latest couple of days (about May 28 - 30th), colder water has extended higher in the water column (towards the top of the plot), whereas back on May 25th the water was warmer than 10°C down to about 10 meters depth.
Water Column Forecasts
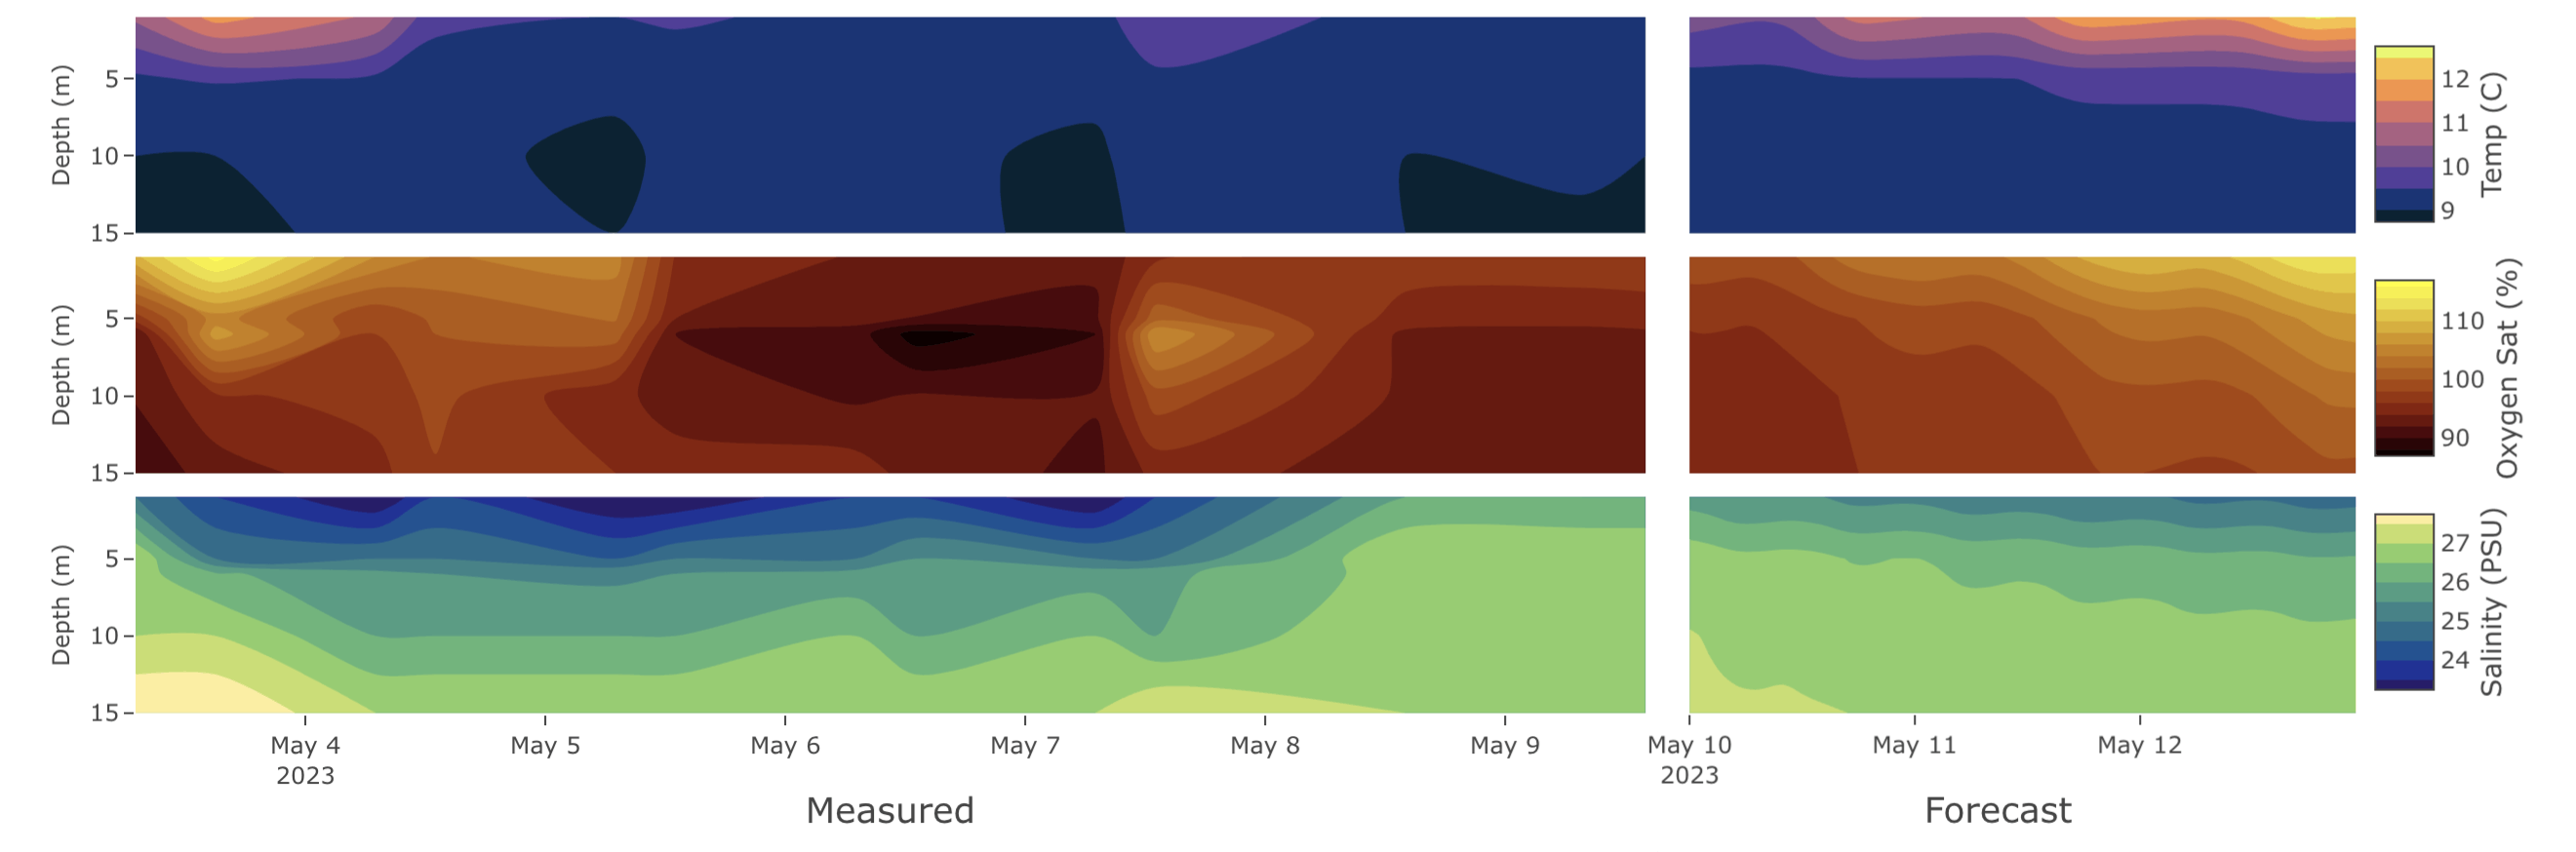
Farm sites running SeaState have access to a three-day forecast of temperature, oxygen, and salinity through the water column. To generate the forecasts, Scoot’s oceanographers create and tune models that simulate the physics of the water column at each individual site. Our models incorporate the influence of local bathymetry, tides, freshwater runoff, upwelling, and biogeochemistry, and are driven forward in time using the atmospheric weather forecast.
In SeaState, ocean forecasts are displayed as contour plots alongside the real-time data coming off a farm site, as shown in the example below. Looking at the middle panel, you can see that over the past few days the site has recorded slightly lower (but not dangerously low) oxygen levels around 5-15 meters depth. But the forecast to the right predicts that warmer, more oxygenated, fresher water will reach the site over the next couple of days. For the farmer, this means that it’s unlikely that their fish will be impacted by a low oxygen event. It might be a good time to schedule any necessary treatments or an opportunity to turn off aeration if they have it running.
Data -> Insights
Scoot is a team of oceanographers and data scientists with a passion for helping operators understand how the background ocean is impacting their business. We often hear from our customers that they’re collecting more ocean data than they have time to explore or process. That’s why our focus is to pull new operational insights out of that data, in real time, to enable more data-driven day-to-day decision making on the farm site.
Please get in touch (info@scootscience.com) if you’re spending too much time wrangling ocean data or if there is something you want to understand better about conditions at your farm site. We’d love to hear from you!